In this article, we are going to learn how to build regression models with PyCaret in Python.
If you don’t have any experience with data science or machine learning, you can read this article for getting some technical and practical stuff.
What is Automated Machine Learning?
AutoML is an application that facilitates (almost automates) the creation of machine learning models.
An AutoML basically finds the algorithm that performs best according to the data you enter and the target metric and presents this algorithm to you.
When AutoML offers you the best performing algorithms, you don’t have to choose the best performing one, you can make the final decision yourself.
PyCaret Properties and Benefits
PyCaret allows you to experiment further by building machine learning models with a few lines.
It has high performance in tasks such as regression, classification, multi-label classification, and it allows you to create these applications with 5 or 10 lines.
Data cleaning is terrible unless you’re a professional data scientist, but PyCaret cleans up your dataset a bit (handling missing values, normalizing data).
All preprocessing transformations are implemented with only 1 function. This means that you can complete the preprocessing by setting a few parameters.
What’s New in PyCaret V2?
The 2nd Generation was announced as a more efficient AutoML library. Let’s take a look at the most important features according to the official blog post.
- Now, when comparing models, you can view which model was trained how long it took.
- PyCaret 2.0 now allows you to save visualizations of your models.
- PyCaret 2.0 supports MLFlow GUI. This GUI for managing machine learning lifecycle, and comparing models performance.
I think these are the most important features but you can read this official blog for learning all features.
Data Cleaning with PyCaret
Normally, a data cleaning job is like a nightmare. Preparing the data for the model is one of the most difficult tasks, but PyCaret automates it.
Therefore, we are going to explore the dataset (looking at what’s data we have, etc.) Now let’s import the data and take a preview.
You can access this dataset from Kaggle. Let’s started with exploring the dataset after that we are going to create a regression model.
# Required Library
import pandas as pd

# Read Dataset
dataset = pd.read_csv("data.csv")
dataset.head(5)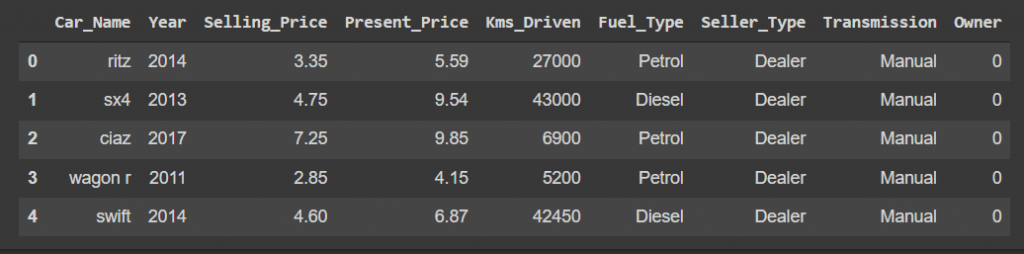
We will make changes to this dataset in the next sections (for performance), but now we are going to drop the Car_Name column.
We are going to split 10% of the dataset before building the model so we can use that reserved portion to test the model.
Now, after briefly examining the data set, we can move on to preprocessing. You can read this article for getting knowledge about preprocessing.
Creating Regression Model with PyCaret
We are going to try to predict the selling price of cars. Firstly, we need preprocessed dataset for the model.
1 – Preprocessing
Briefly, we are going to prepare the dataset for the regression model with 1 function. We determine our main goal at this stage.
The setup function initializes the environment in PyCaret and creates the transformation pipeline to prepare the data for modeling and deployment.
Operations such as encoding, removing missing value, outliers editing, normalization is done automatically with the Setup function.
The data parameter takes the dataset to edit. The target parameter allows us to specify our main target (variable to be estimated).
Finally, the session_id is the pseudo-random number that is then deployed as seeds across all functions for reproducibility.
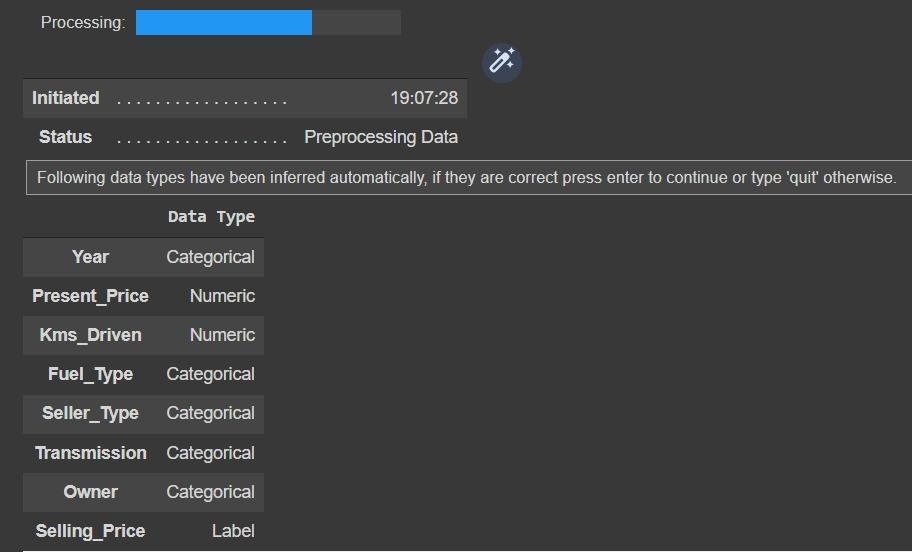
When you run the function, you should see an output like this. This output shows you the data type of the columns and asks you to validate.
Column data types are vital to machine learning models, so they are important to check. If it’s true, just press enter to confirm.
After you approve, you will see a breakdown of the preprocessing processes, you can get information by examining it.
2 – Comparing Models
If you don’t know which machine learning model to use, you can compare all regression models.
You can choose the best regression model based on the R2 Score (or other metrics). PyCaret lists the models according to the accuracy.
# Compare all regression model
compare_models()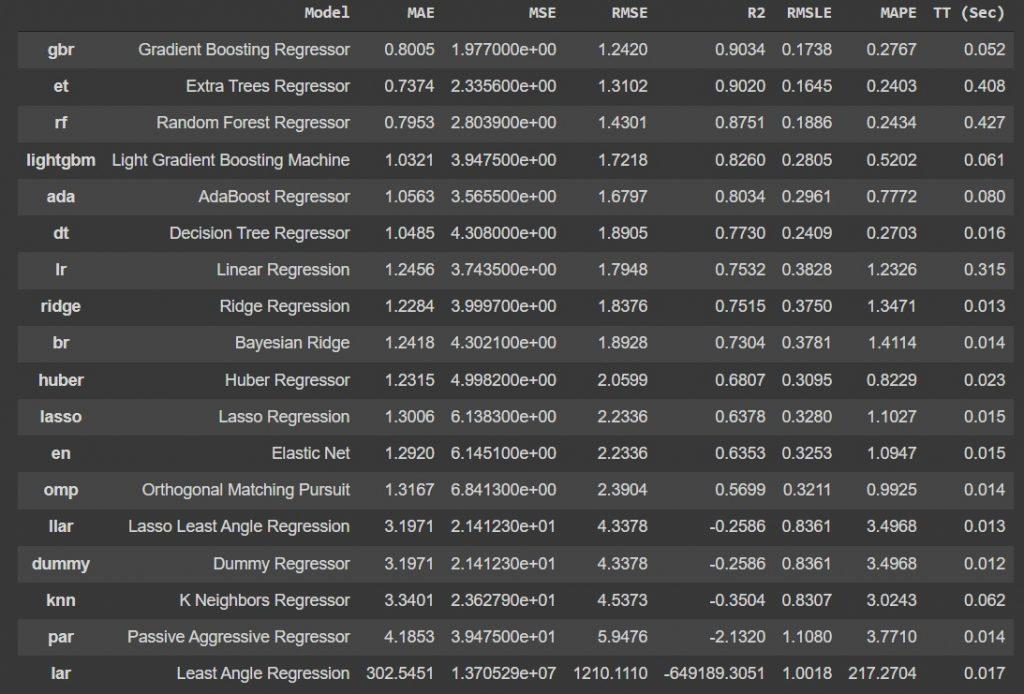
With just one function, you can compare 18 machine learning models on a table. The first 3 may change their efficiency after the processes at the end of the article.
After examining the accuracy rates of the models, it is time to create the model, we will create and test the first 3 models.
3 – Creating ML Model
We can create a model with the create_model function. This function allows creating a model with our selection.
The function takes 1 parameter. This parameter takes the abbreviation of the model name. You can find the abbreviation in compare dashboard.
# Gradient Boosting Regressor
gbr = create_model("gbr")

# Extra Tree Regression
etr = create_model("et")

# Random Forest Regressor
rfr = create_model("rf")
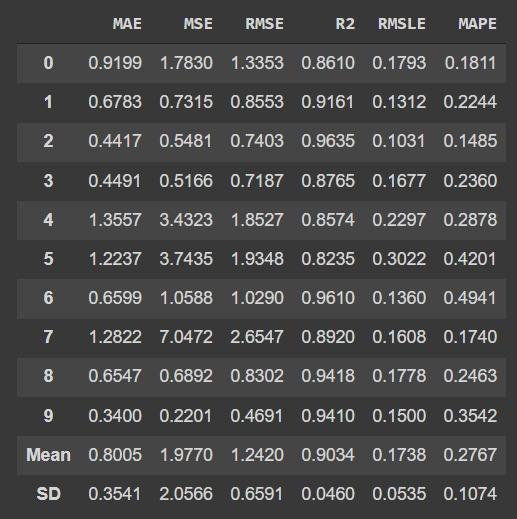
When the model is built and trained, you can see the average accuracy score of the data and the accuracy ratio of the first 10 rows.
After the function is called, it returns the trained model object, store it in a variable for later use.
We will also train the first 3 regression models that perform best, so we can check which model performs better at the end.
4 – Tuning Model Hyperparameters
You can tune model hyperparameters automatically with PyCaret. When you create a model, it’s created with default hyperparameters.
Thanks to a function called tune_model, you can automatically adjust the hyperparameters of your model and see the efficiency increase in a table.
# Tune First Model
tunedGbr = tune_model(gbr)

# Tune Second Model
tunedEt = tune_model(etr)

# Tune Third Model
tunedRfr = tune_model(rfr)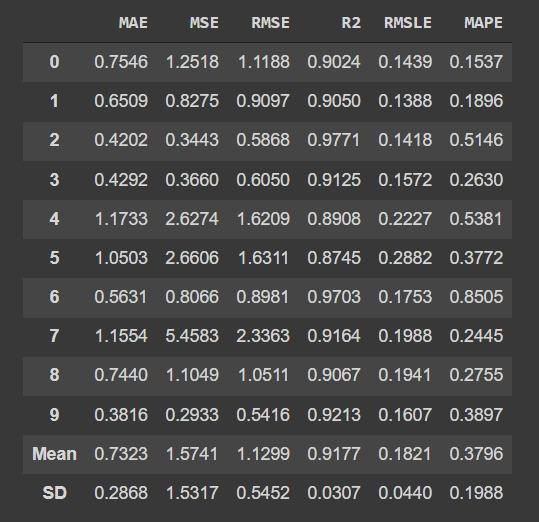
Sometimes, the tuned model is shown less performance than the not tuned model. For these cases, you can use the “choose_better” parameter, this parameter selects the best model.
Parameters such as “n_iter” can be used, but this is the subject of another article so I’ll skip it for now.
5 – Visualizing Model
Before testing the model, you can visualize it to inspect it thoroughly. PyCaret provides functions to visualize important data.
It has essential graphic functions such as PyCaret Residual Plots, Prediction Error, Feature Importance.
# Residual Plot
plot_model(tunedGbr)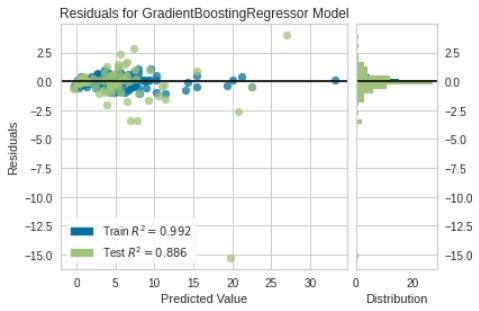
It shows whether your data is suitable for the regression model. It also allows you to find outliers.
# Prediction Error Plot
plot_model(tunedGbr,plot="error")
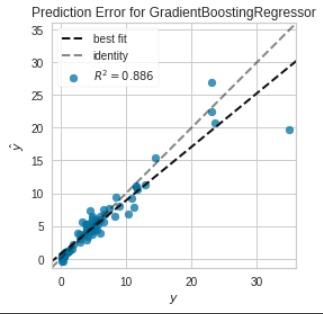
A prediction error plot shows the actual targets from the dataset against the predicted values generated by our model.
# Feature Importance Plot
plot_model(et,"feature")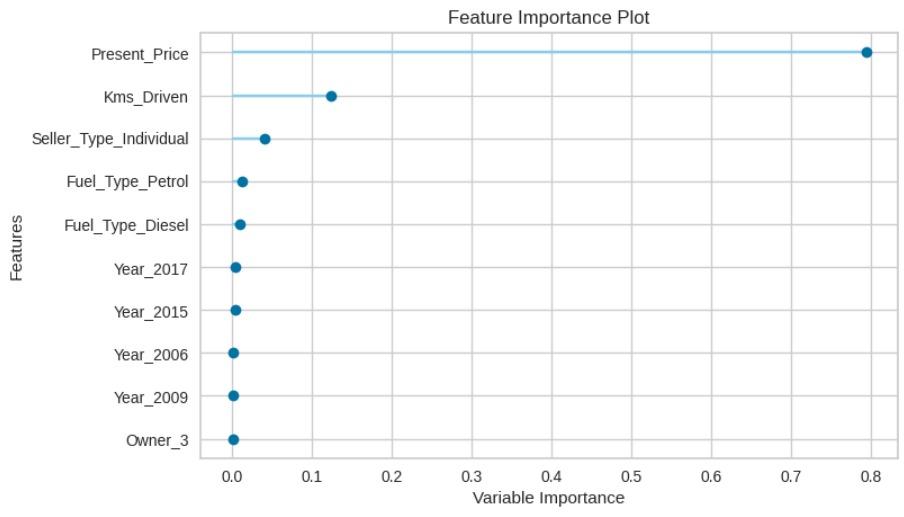
It is a plot that shows the order of importance of the variables you give to the model. According to this chart, you can limit the variables you give to your model.
6 – Predicting Test Data
We’ve completed almost everything, now we have to predict the test data with our trained model.
PyCaret offers you a function called predict_model to predict test data, this function returns the predicted value and real value.
# Predict Test Data
predict_model(tunedGbr)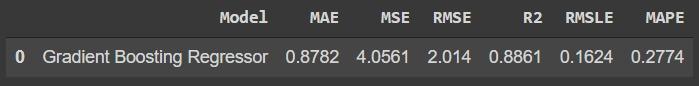
Finally, before deploying the model, we can use the whole dataset to train the model with the help of finalize_model.
This should ensure your model performs at its best. After this stage, we will test the model with the data we have previously reserved.
# Finalize Model
finalGbr = finalize_model(tunedGbr)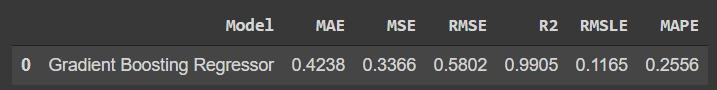
As you can see, the R2 score is the almost perfect level (the highest R2 score is 1). Now that we’ve finished the final version of the model, we can move on to the next.
7 – Predicting Unseen Data
We initially reserved 10% of the original dataset that was not processed by PyCaret, and now we are going to use it for the testing final model.
The predict_model function can also be used to predict incoming data (other than training and test data).
You need to use the data parameter to make it predict the next data. Now let’s predict the unseen data.
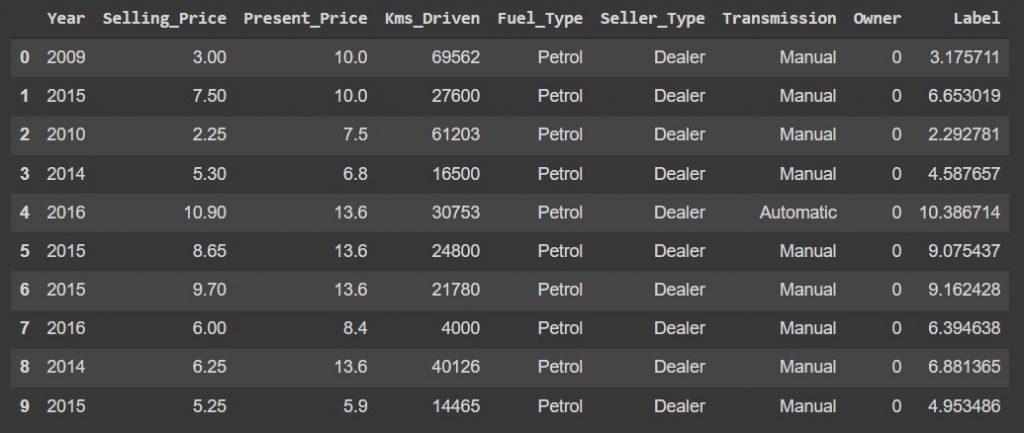
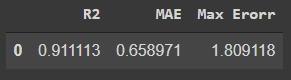
The label column appended to the end of the test data contains the prediction data. With the help of Sklearn, we can learn the R2 score and Mean_Absolute_Error value.
Sklearn metrics library provides us with accuracy metrics that PyCaret calculates automatically. Thus, we can calculate the accurate value of the model manually.
Now we have the two-parameter values that the r2_score function needs, the actual data, and the predicted data.
Since it passed our last test, let’s save our model for later use. PyCaret also offers an automated solution for saving the model.
8 – Saving Final Model
If you want to use the model again when you receive new data after completing the experiment, you do not need to restart the experiment, just save the model.
PyCaret allows you to save and call your model in two steps, for this we use the save_model and load_model functions.
# Save Model
save_model(finalGbr,"GBR Model (Version: 1)")

# Load Model
savedGbr = load_model("GBR Model (Version: 1)")
While specifying the model name, you can write the version number in terms of version control, then you should use the full name when calling the model.
You can use a reloaded model to predict different data again with the predict_model function.
Conclusion
Finally, we created a regression model with 10 or 20 lines of code. Now we can predict the selling price with some independent value.
You can find the code file and dataset in my Github account. Don’t forget to check out the new articles, and happy coding!