In this tutorial, we’ll work with Python and R programming languages to explore the basics of data visualization. This lesson for new learners of data visualization.
Basic knowledge of Python or R will be useful for the tutorial but is not required. The tutorial will explain the basics to you in the simplest way.
Data Visualization Basic
Let’s start by getting to know the subject we have learned, data visualization is a method used to present the correct information that we obtain.
In order to recognize the data and increase its readability, in short, data visualization is used to increase efficiency by visualizing digital, text-based data.
Python and R programming languages are currently the two most used programming languages for data visualization. After this training, you will be able to create simple graphs.
We will publish the second part of this course, you can follow the course to continue learning. In the second part, we will talk about more technical stages and how to make more advanced graphics.
Creating Simple Empty Chart
In Python, every window we use to store graphics is called a figure. Now let’s create a figure, then we will fill it with a graphic.
# For creating graphics
import matplotlib.pyplot as plt

# Create graphic
fig = plt.figure()

# Show graphic
fig.show()
Since the R programming language is specially prepared for statistics, you do not need any library, you can create an empty graphic with a single function.
# Create empty graphic
plot.new()
Preparing Data For Graphics
To create a 2D graph, we need 2 datasets as x-axis and y-axis to put these datasets as a list, array, etc. you can store it in these forms.
# For Creating Array
import numpy as np

x = np.array([1 , 2 , 3 , 4 , 5])
y = np.array([10 , 20 , 30 , 40 , 50])
The R programming language offers a special vector class, since this class is very suitable for creating graphics, we will use vectors.
x <- c(1 , 2 , 3 , 4 , 5)
y <- c(10 , 20 , 30 , 40 , 50)
Now that our data is ready, we can begin to visualize them. You may think that the R programming language is simpler and easier until now.
However, people who have previous programming language experience such as C ++ and Java may not be able to easily warm up to the R programming language.
Creating Chart With Data
We will create a chart using the data we have previously created. We will create a line chart in Python We will create a scatter chart on R (we will see these concepts later).
# For creating plot
import matplotlib.pyplot as plt
plt.figure()
# Create Plot With X Axis And Y Axis
plt.plot(x , y)
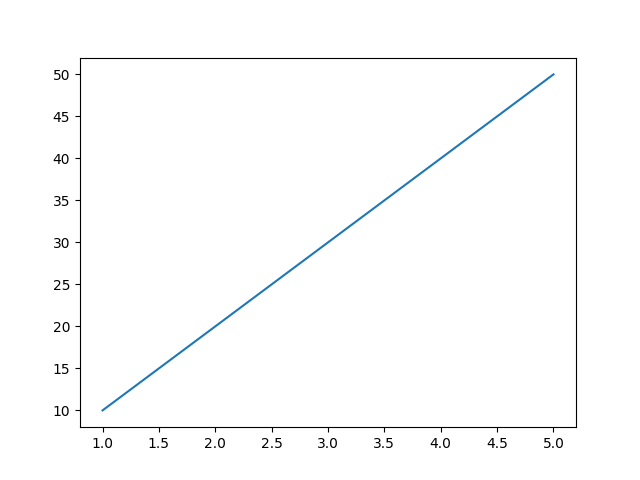
plt.show()You can quickly create a chart with the help of the plot function. Now let’s examine this chart (attention: do not delete the variables you have previously created).
Creating line graphs on R is as easy as in Python, you can create it with a single function. In the following section, we will create a line chart as in Python, for now, a scatter will be created by default.
# Create plot with x and y axis
plot(x , y)
You can use it in complex data instead of constantly increasing data. Now let’s look at how we can customize the graphics to increase readability and efficiency.
Note: The graphic we created on R will appear as a dotted graph called scatter. In the next section, we will change the type of the graph with the parameter of the plot function.
Customizing Graphic
After transferring your data to graphics as standard, you need to develop the graphics to increase efficiency. You can use plot parameters for this.
import matplotlib.pyplot as plt
fig = plt.figure()
plt.plot(x,
y,
label="Line1",
color="lightblue",
linewidth=3,
marker="o",
mfc="black",
markersize=12)
plt.title("Main Title")
plt.xlabel("X Axis Title")
plt.ylabel("Y Axis Title")
plt.legend()
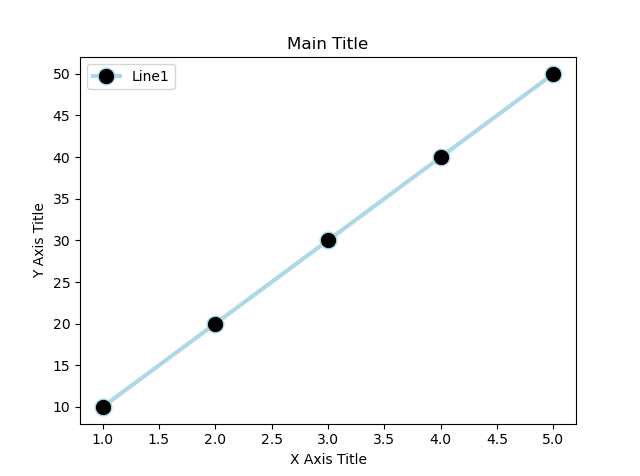
plt.show()We will focus more on this topic in the next lessons, we are in preparation for the subject of styles and markers.
label = You can name each line created for line charts.

color = Used to change the colors of the lines

linewidth = used to adjust the thickness of the line

marker = used to mark the data contained in the dataset

markerfacecolor = used to change the color of the marker

markersize = adjusts the size of the marker

title = Used to give a main title to the chart.

xlabel = We use it to name the data on the x-axis

ylabel = We use it to name the data on the y-axis

legend = to apply the customizations in the chart to the chart.
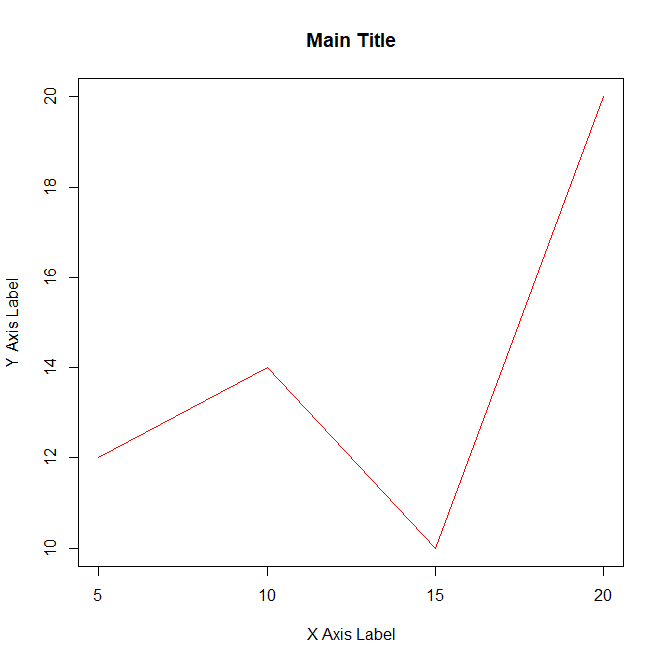
We’ve completed our first graph, now let’s make it on R. After completing this graph, we will learn a few tips on data visualization.
xAxis <- c(5 , 10 , 15 , 20)
yAxis <- c(12 , 14 , 10 , 20)

plot(xAxis,
     yAxis,
     type = "l",
     xlab = "X Axis Label",
     ylab = "Y Axis Label",
     col = "red",
     main = "Main Title")
type = It is used to change the type of the chart. xlab = We use it to name the data on the x-axis ylab = We use it to name the data on the y-axis col = Used to change the colors of the marker or line main = Used to give a main title to the chart.
Tips For Data Visualization
You understand that the code is simple and straightforward, but what exactly makes data visualization difficult?
Visualizing data is not a very difficult process, before this, processes such as collecting data and analyzing data tire the person more, data visualization can be thought of as summarizing the operations done in the past.
Converting each data set into a graph is a waste of time, it is more appropriate to graph the data you find important or the data to be presented.
This article explains how you can do data visualization in both programming languages. Using R or Python is up to the individual.