
Using Django or Flask may be difficult in creating a data app, you can create a data-driven web app with Streamlit on Python.
Whether you’re a data scientist or a machine learning engineer, being able to deploy your project is an important skill that will take you forward in your career.
we’ll learn the basics of Streamlit and the features we can use when building a data application, also create simple demo apps.
Learn Basics of Streamlit
In this section, we will learn about the important functions and features that we use when creating applications.
Let’s do the installations, then start the first localhost (we will use the file on the localhost you will start, so I suggest you set up a good project layout yourself)
pip install streamlit
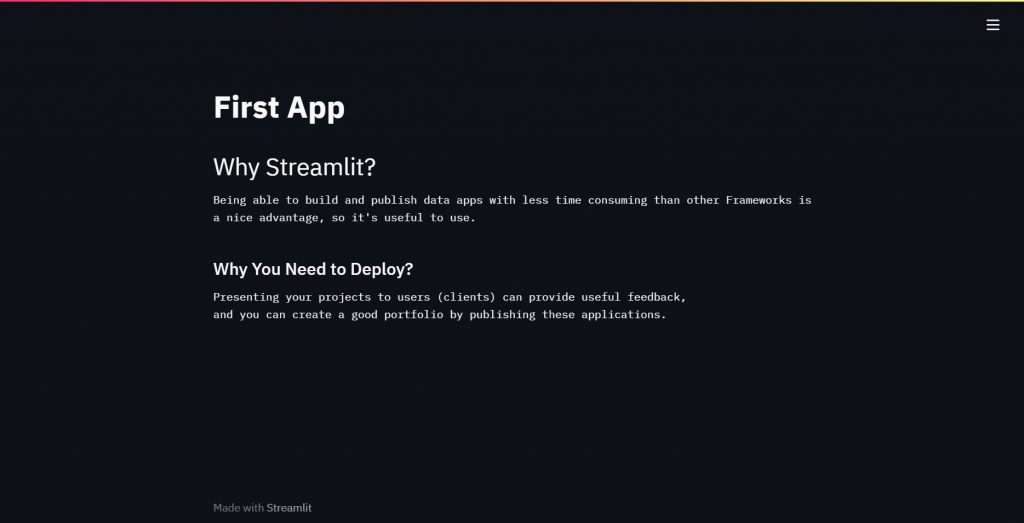
streamlit run main.pyAfter the Streamlit installation is complete, localhost should be opened. Port 8051 is mostly used. You should see an empty web page like the one below.
Your theme may be white depending on the situation, it depends on system preferences now let’s examine the functions and basic settings on streamlit.
Simple Settings on Streamlit
You can open the settings menu from the three lines in the upper right, here we have a few features, which we will examine in this section.
1 – Rerun
as the name suggests it will run your file again so you can test your algorithm over and over. prevents you from starting Streamlit again.
2 – Clear Cache
It allows you to clear the cache where subcommands and data are stored in your running program.
3 – Deploy App
You can publish your project in one of the repositories on Github, all you have to do is turn on remote hosting with your GitHub account.
4 – Record a screencast
This will record a video with the contents of your screen, so you can easily share what you’re seeing with others.
5 – Settings
You can choose your theme from here, and it offers an option to save the file every time you run your project.
Basic Streamlit Functions
In this section we will see frequently used Streamlit functions, you need to add all of these commands to the file where you start the host.
It would be helpful to think of that file as the main source file. The building block of your application is the Python file you use to start the web host.
# Library
import streamlit as st

# Creating Title
st.title("First App")
After adding the header, let’s learn the header and subheader commands. You can use these features for taking notes or preparing the project.
# Header
st.header("Big Header")

# Subheader
st.subheader("Small SubHeader")
Of course, titles alone are not enough, now let’s learn to write text, then we will look at editing these texts with markup.
st.text("Your Text")You can see the sample demo I prepared using these functions in the picture below, and you can practice it.
You can find all the demos in this article on my Github. Just click here and get the codes. Now let’s see how to use markdown.
st.markdown("### Markdown")If you know the Markdown commands, you can use them all with this function, code blocks, headers are all included.
Success , Info , Warning , Erorr , Exception
Here we will see the functions that you can use when debugging or reporting a problem to the user.
# Success
st.success("Finish")

# Info
st.info("Info")

# Warning
st.warning("Attention")

# Erorr
st.error("Crashed")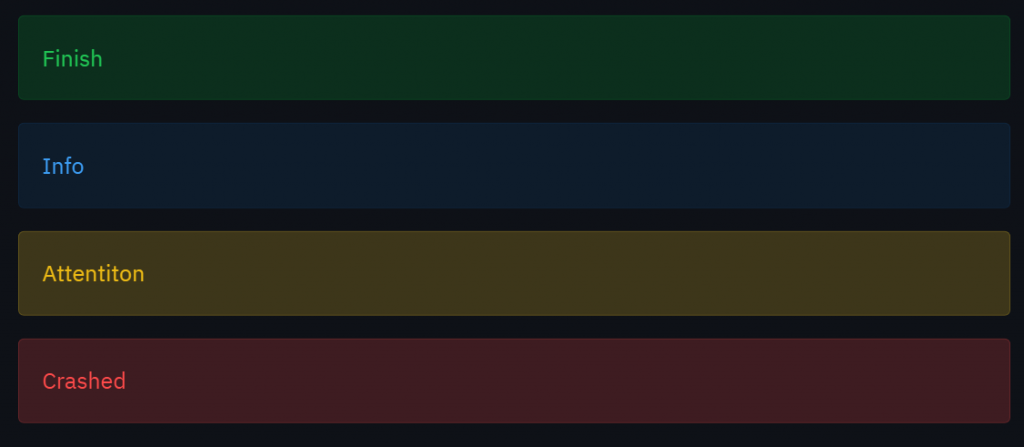
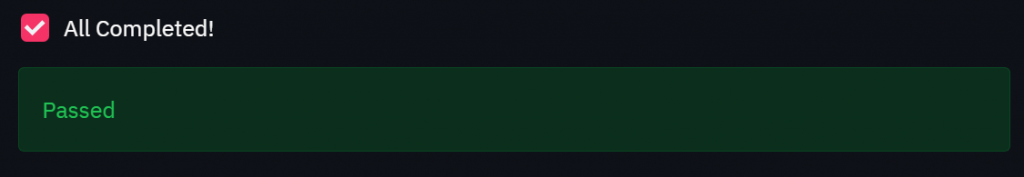
Checkbox & Radio Button
With the help of the checkbox function, you can create a boolean and react accordingly to the user. for example, you can create a checkbox to finish input.
if st.checkbox("All Completed!"):
  st.correct("Passed")
When you press the button, you will receive a warning stating that you have passed. You can preview it below.
Now let’s learn to use the Radio Button, it returns a boolean value just like the checkbox so you can use it with if-else statements.
level = st.radio("Level:", ('>100', '<100'))

if (level == '>100'):
    st.success("Passed")

else:
    st.erorr("Not Enough")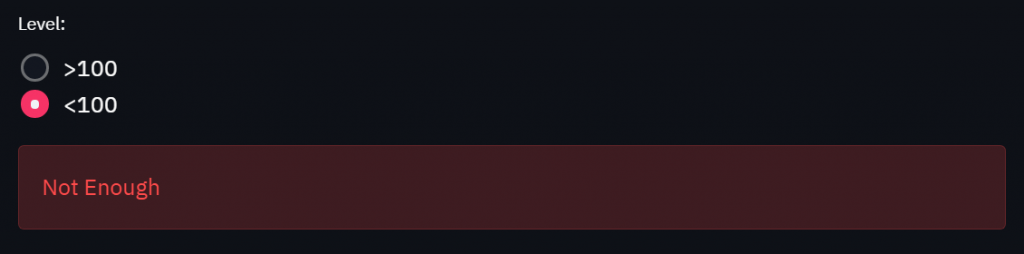
Button & Input Text
We have the last 2 functions left, from now on we will learn about functions that are closely related to data science. Here functions are the basic building blocks of Streamlit.
btn = st.button("Click Here For Message")

if(btn):
    st.success("Welcome")

elif(btn == False):
    st.info("Click Button")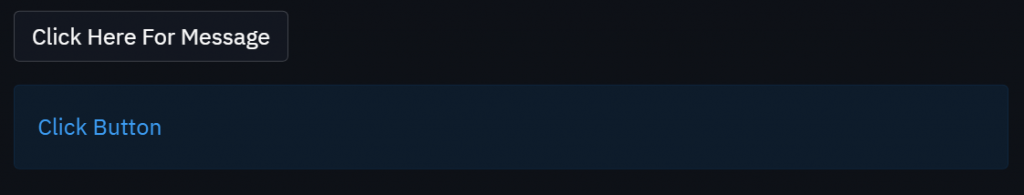
Input Text is also frequently used in machine learning applications. We often will use Input Text in the demo project where we are trying to predict the entered values.
It takes 2 parameters, the first parameter is the title above the input text, while the second parameter is the text to be written on the text box.
gender = st.text_input("Enter Gender" , "Type")
accept = st.button("Submit")

if(accept):
 txt = gender.title()
 st.success("Your Genre" , txt)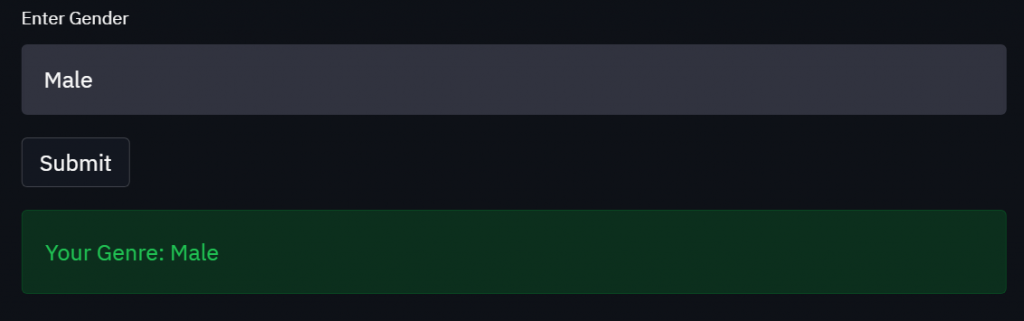
Slider & Number Input
We have come to the end of the basics. In this section, we will learn about the last elements (functions), a slider that accepts integers in a certain range, and Number Input, the numeric version of Text Input.
vol = st.slider("Volume", 0,100)
st.write(f"Volume: {vol}")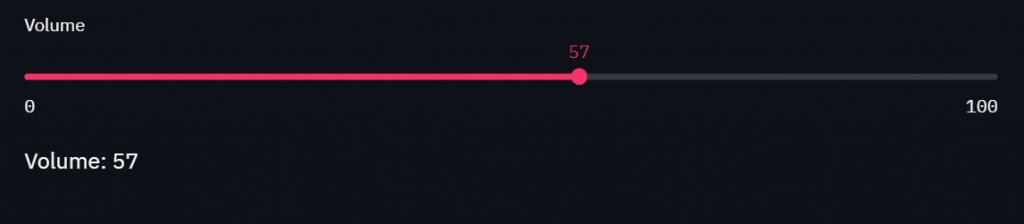
age = st.number_input("Age:")
st.write(f"Age: {age}")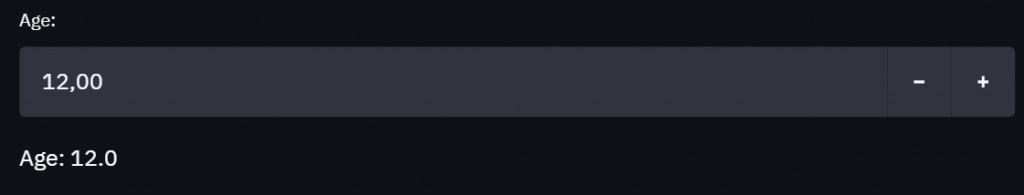
Now that we’ve finished the basics, we can do the 2nd sample demo. In this demo, we’re going to do a small survey application. You can get the codes from Github.
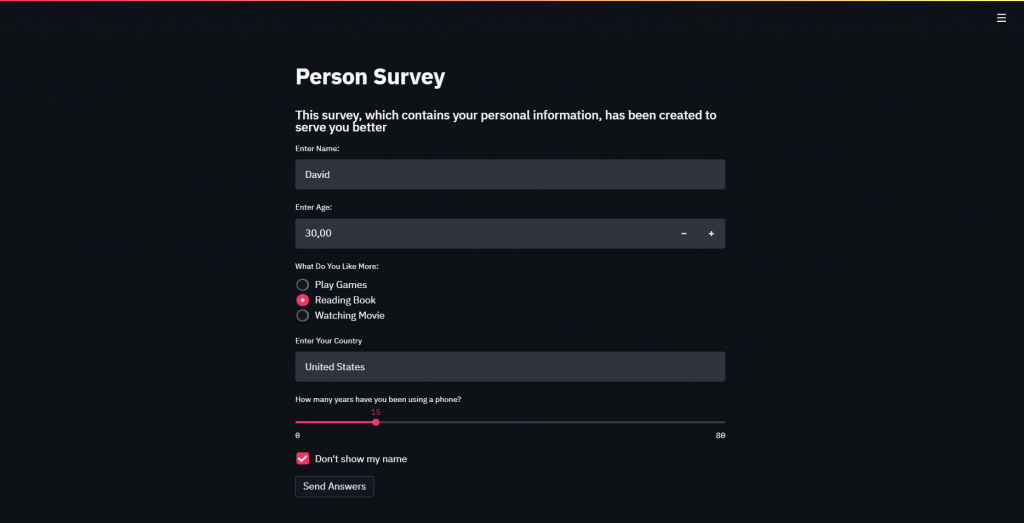
We made a simple survey demo, using every component we learned in this demo, now let’s learn the information needed to build a data application.
Learn Basics of Streamlits For Data Apps
In this section, I have collected the most used functions that you can use when publishing your data science projects that I think will be useful for you.
I also created a demo where you can practice by combining them with real-life problems so we can repeat what we have learned.
Display Data on Streamlits
Don’t you want visualization like Jupyter Notebook when publishing your data apps? Streamlit offers features for display your data.
st.dataframe(data,width,height)The first parameter should take an array, dictionary, data frame, styler, the second and third arguments are for the dimensions of the table.
# Create Array
import numpy as np

data = np.arange(0 , 100)
data = data.reshape(5 , 20)

st.dataframe(data)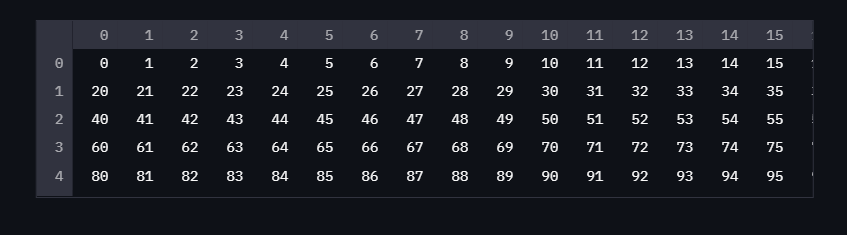
Let’s embellish a bit with the functions we learned earlier. Let’s create 2 different data frames and provide information about them.
import streamlit as st
import numpy as np

data = np.random.random(100)
data = data.reshape(5 , 20)

data2 = np.random.random(100)
data2 = data.reshape(5 , 20)

st.markdown("# 1'st DataFrame")
st.dataframe(data)

st.markdown("# 2'nd DataFrame")
st.dataframe(data2)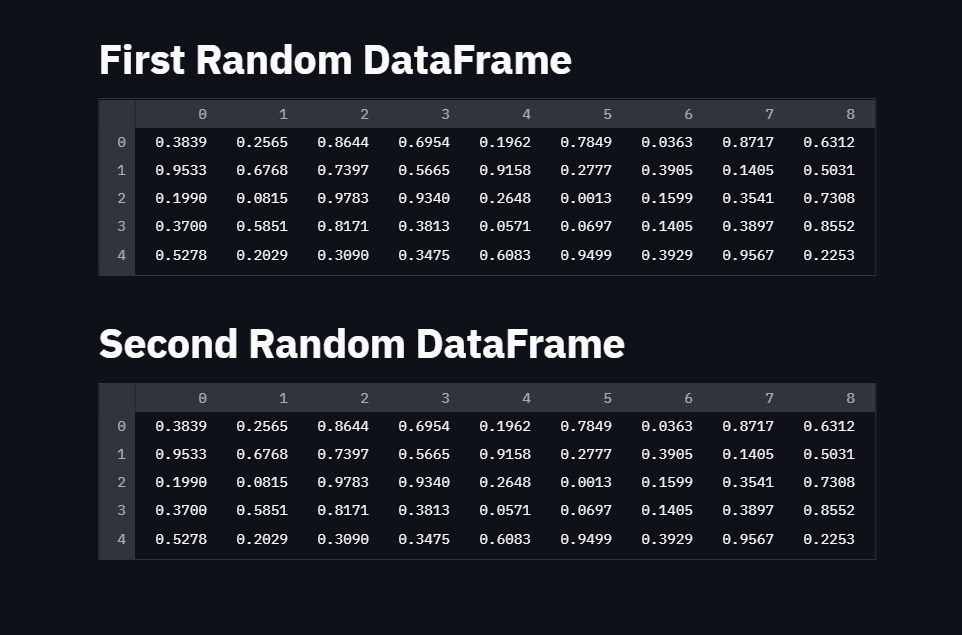
Display Charts on Streamlit
Just as important as visualizing data is creating and customizing graphs. In this section, we will look at how to create a chart on Streamlit and the types of charts.
# Library
import numpy as np

data = np.arange(0,100,2)
st.line_chart(data)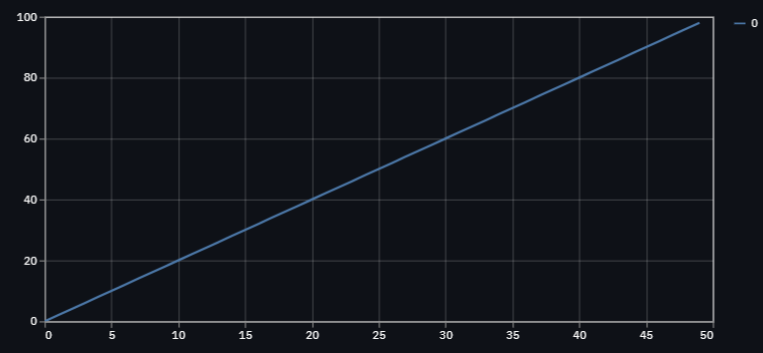
Colors and Legends are determined automatically. Instead of uniform data, let’s use 3 different data sets and see the difference.
data = np.random.rand(27 , 3)
df = pd.DataFrame(data,columns=["x","y","z"])

st.line_chart(df)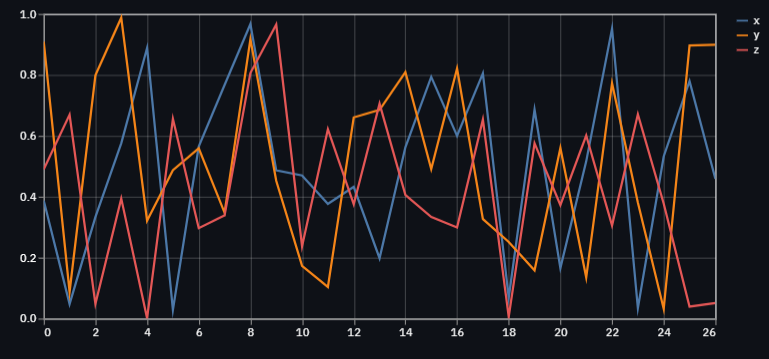
As you can see, every label and color on the chart is adjusted automatically, no action is required.
The next chart type will be bar charts. We will again use random numbers instead of categorical data.
data = np.random.rand(27 , 3)
df = pd.DataFrame(data,columns=["x","y","z"])

st.bar_chart(df)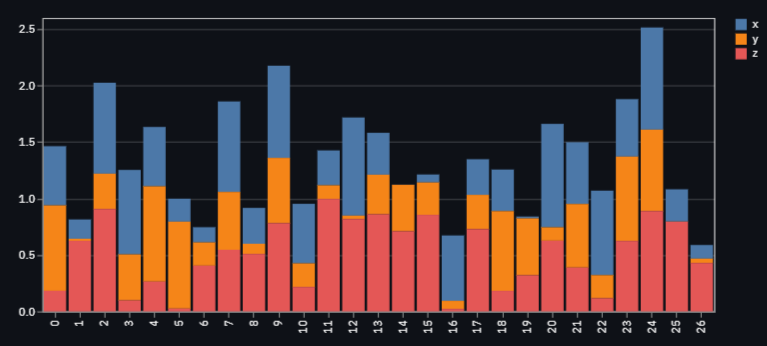
All edits are made by Streamlit, just like the line chart. You just deal with data cleaning and analysis and leave the rest to Streamlit.
You can use matplotlib to generate histograms, then simply display the figure with the pyplot function.
# Library
from matplotlib.pyplot as plt
from numpy import random as np

arr = np.normal(1, 1, size=100)
fig = figure()
fig.hist(arr, bins=20)

st.pyplot(fig)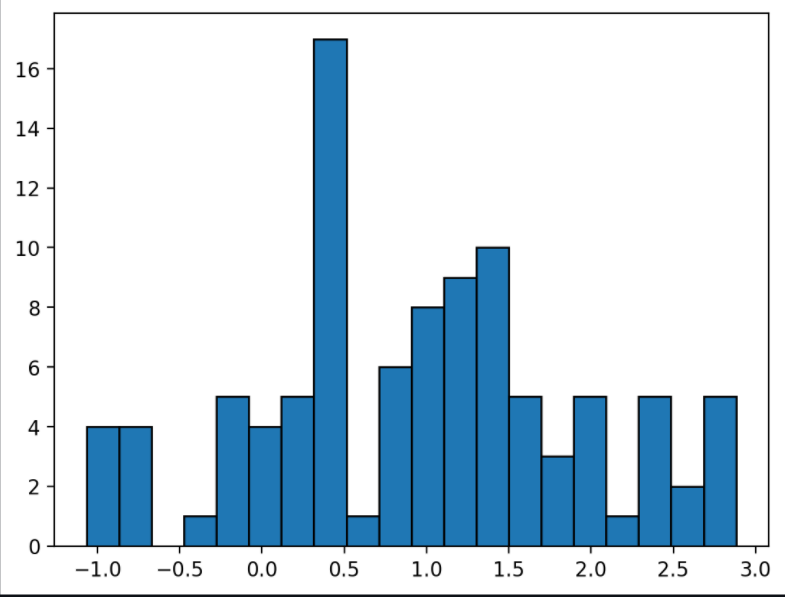
Again, it’s helpful to use the pyplot function, as creating scatter plots is easy in matplotlib. You can create a scatter graph with the code below.
# Library
import matplotlib.pyplot as plt
from numpy import random as np

plt.style.use("ggplot")

arr = np.random(100)
arr1 = np.random(100)

ax = fig, ax = plt.subplots()
ax.scatter(arr , arr1)

st.pyplot(fig)
Creating Simple Data App
In this section, we’ll deploy the apparent temperature prediction algorithm based on humidity, wind speed, and temperature, which we prepared, with Streamlit.
Like the survey web application, you can find all the codes of this project on the Github repository.
# Import Dataset
data = pd.read_csv("data.csv")

# Dataset Slicing
x = data.iloc[: , [3,5,6]]
y = data.iloc[: , 4]
We prepared the dataset, create the model, after that, we’ll get the predictions and start creating the application.
from sklearn.model_selection import train_test_split as tts


x_train, x_test, y_train, y_test = tts(x, y, test_size=0.3)
# Fit Regression
reg = LinearRegression()
reg.fit(x_train , y_train)We have prepared the model, now we will start spreading the machine learning application over Streamlit, we will predict the result of the values we will enter and print it on the screen.
# Create Inputs
temprature = st.number_input("Temprature:")
wind_speed = st.number_input("Wind Speed:")
humidity = st.number_input("Humidity:")

# Show Predict
pred = reg.predict([[temprature , humidity , wind_speed]])
btn = st.button("Submit")

if(btn):
    st.success(f"Apparent Temperature: {pred}")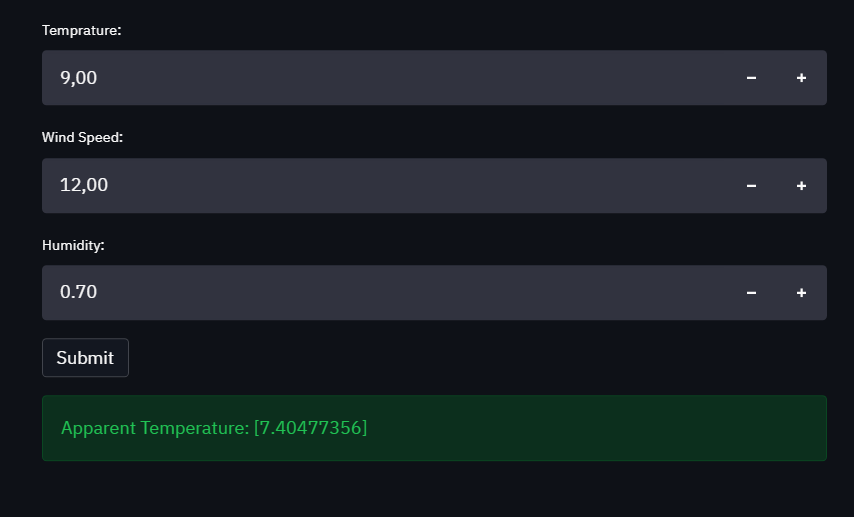
Congratulations, you’ve learned enough to publish your own data science projects.
Each int value entered is written to the multiple regression and the apparent temp is calculated with the estimation algorithm.